
Web App
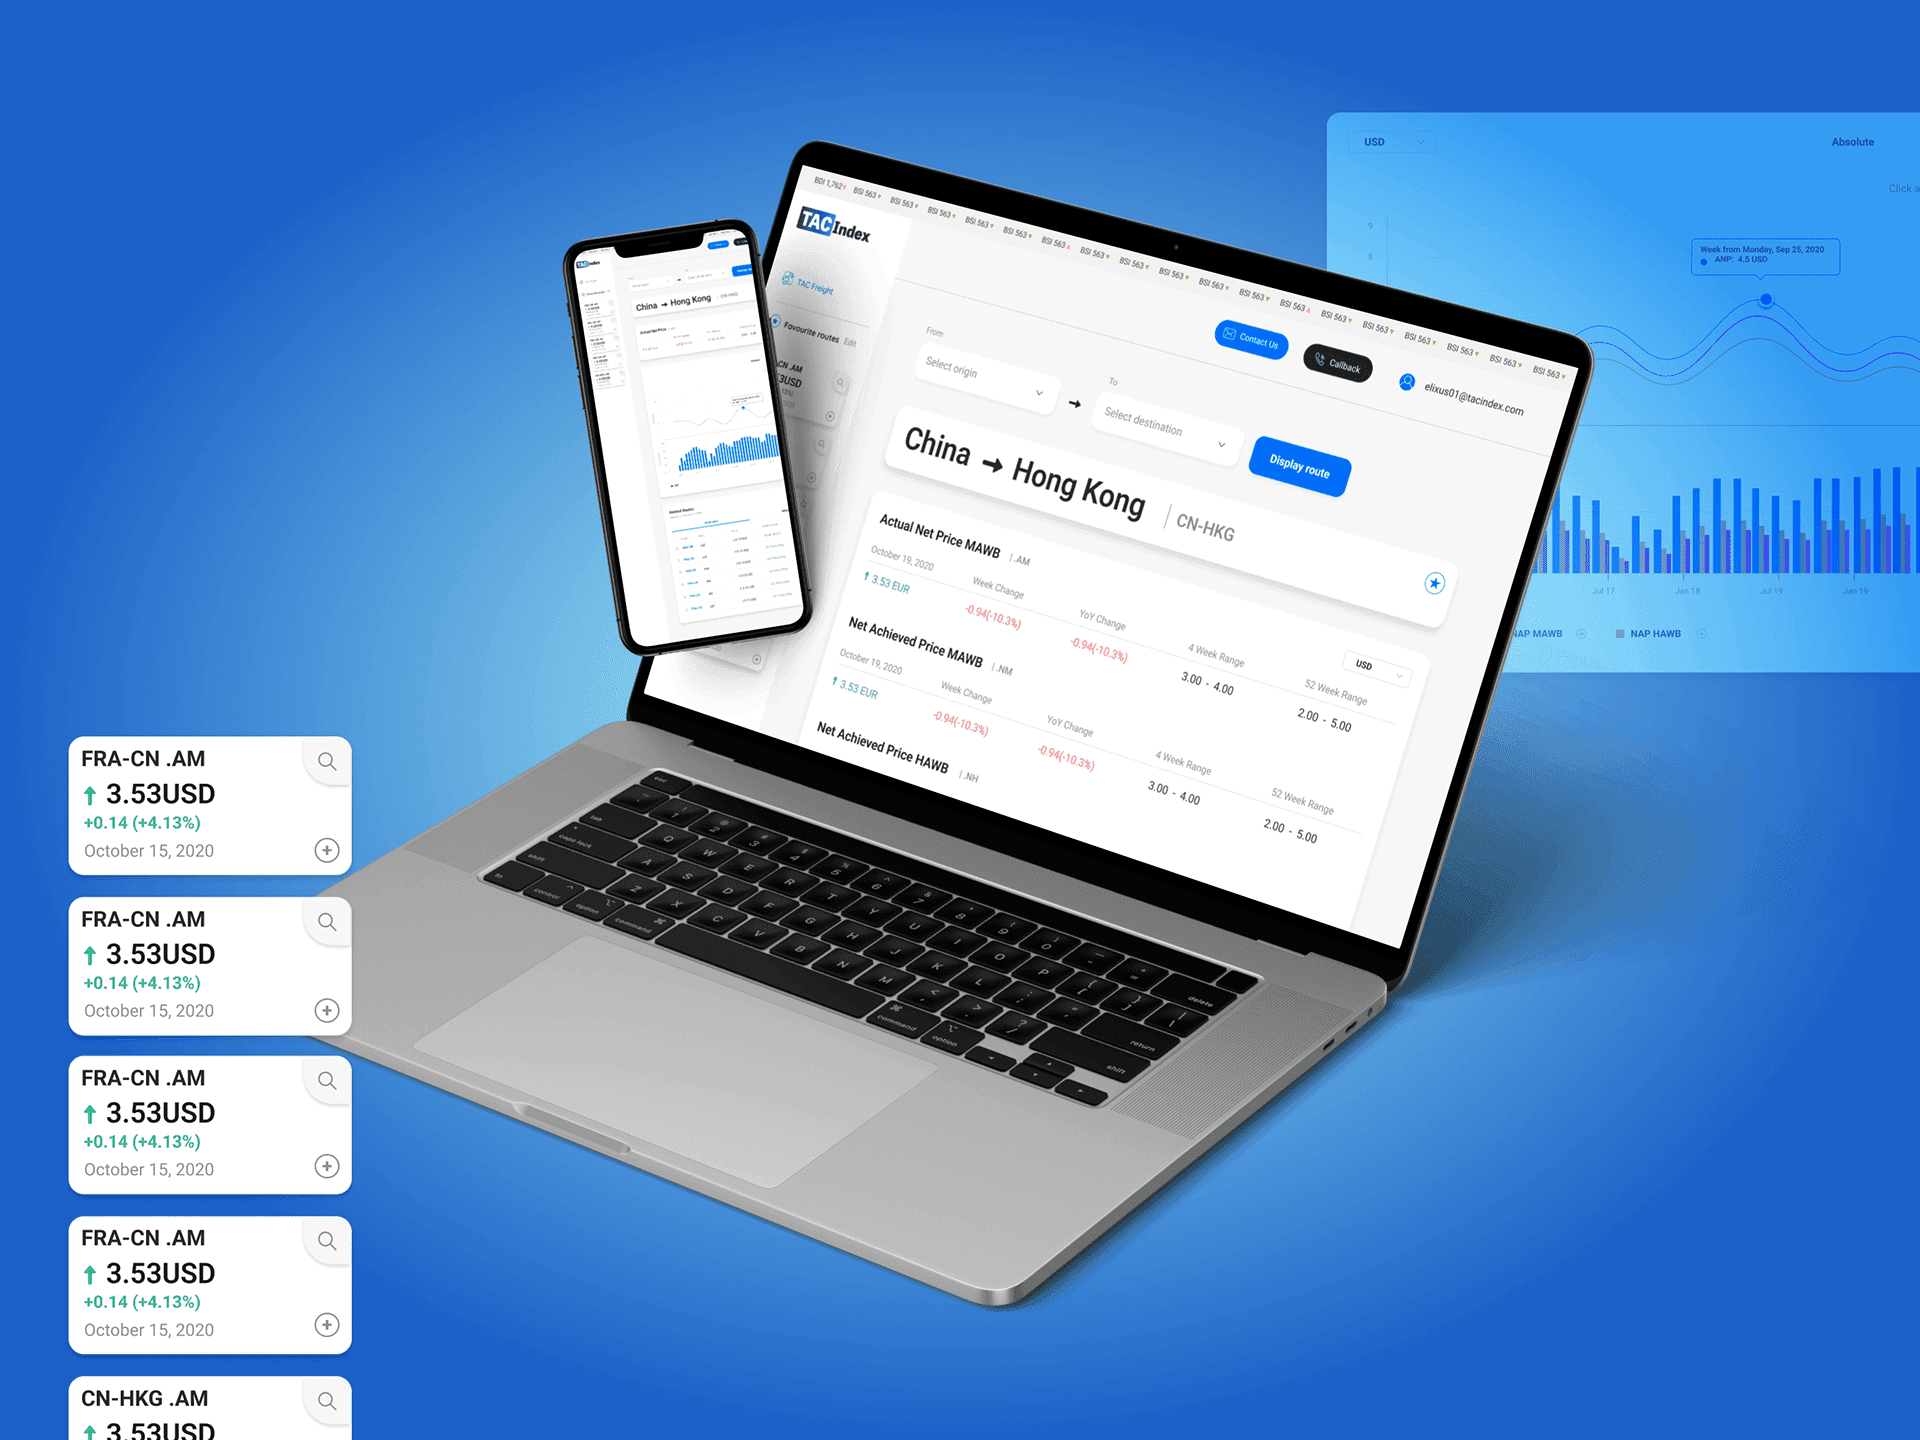
Tac Index Dashboard
Overview
TAC Index is a highly reputable and trusted source of precise and reliable reference pricing information for the global general cargo industry. The company is known for its commitment to providing accurate and up-to-date pricing data that is both independent and unbiased, ensuring that clients can make informed business decisions based on the most reliable market intelligence available.
Challenges
TAC Index’s original dashboard struggled to serve its broad user groups. Key issues included:
A complex and unintuitive layout
Difficulty locating critical price and route information
Poor visual hierarchy, causing cognitive overload
Limited ability to compare data or understand market movement
High churn due to low usability and lack of actionable insights
The challenge was to design a streamlined interface that met the analytical depth required by experts while remaining simple enough for new users.
Results
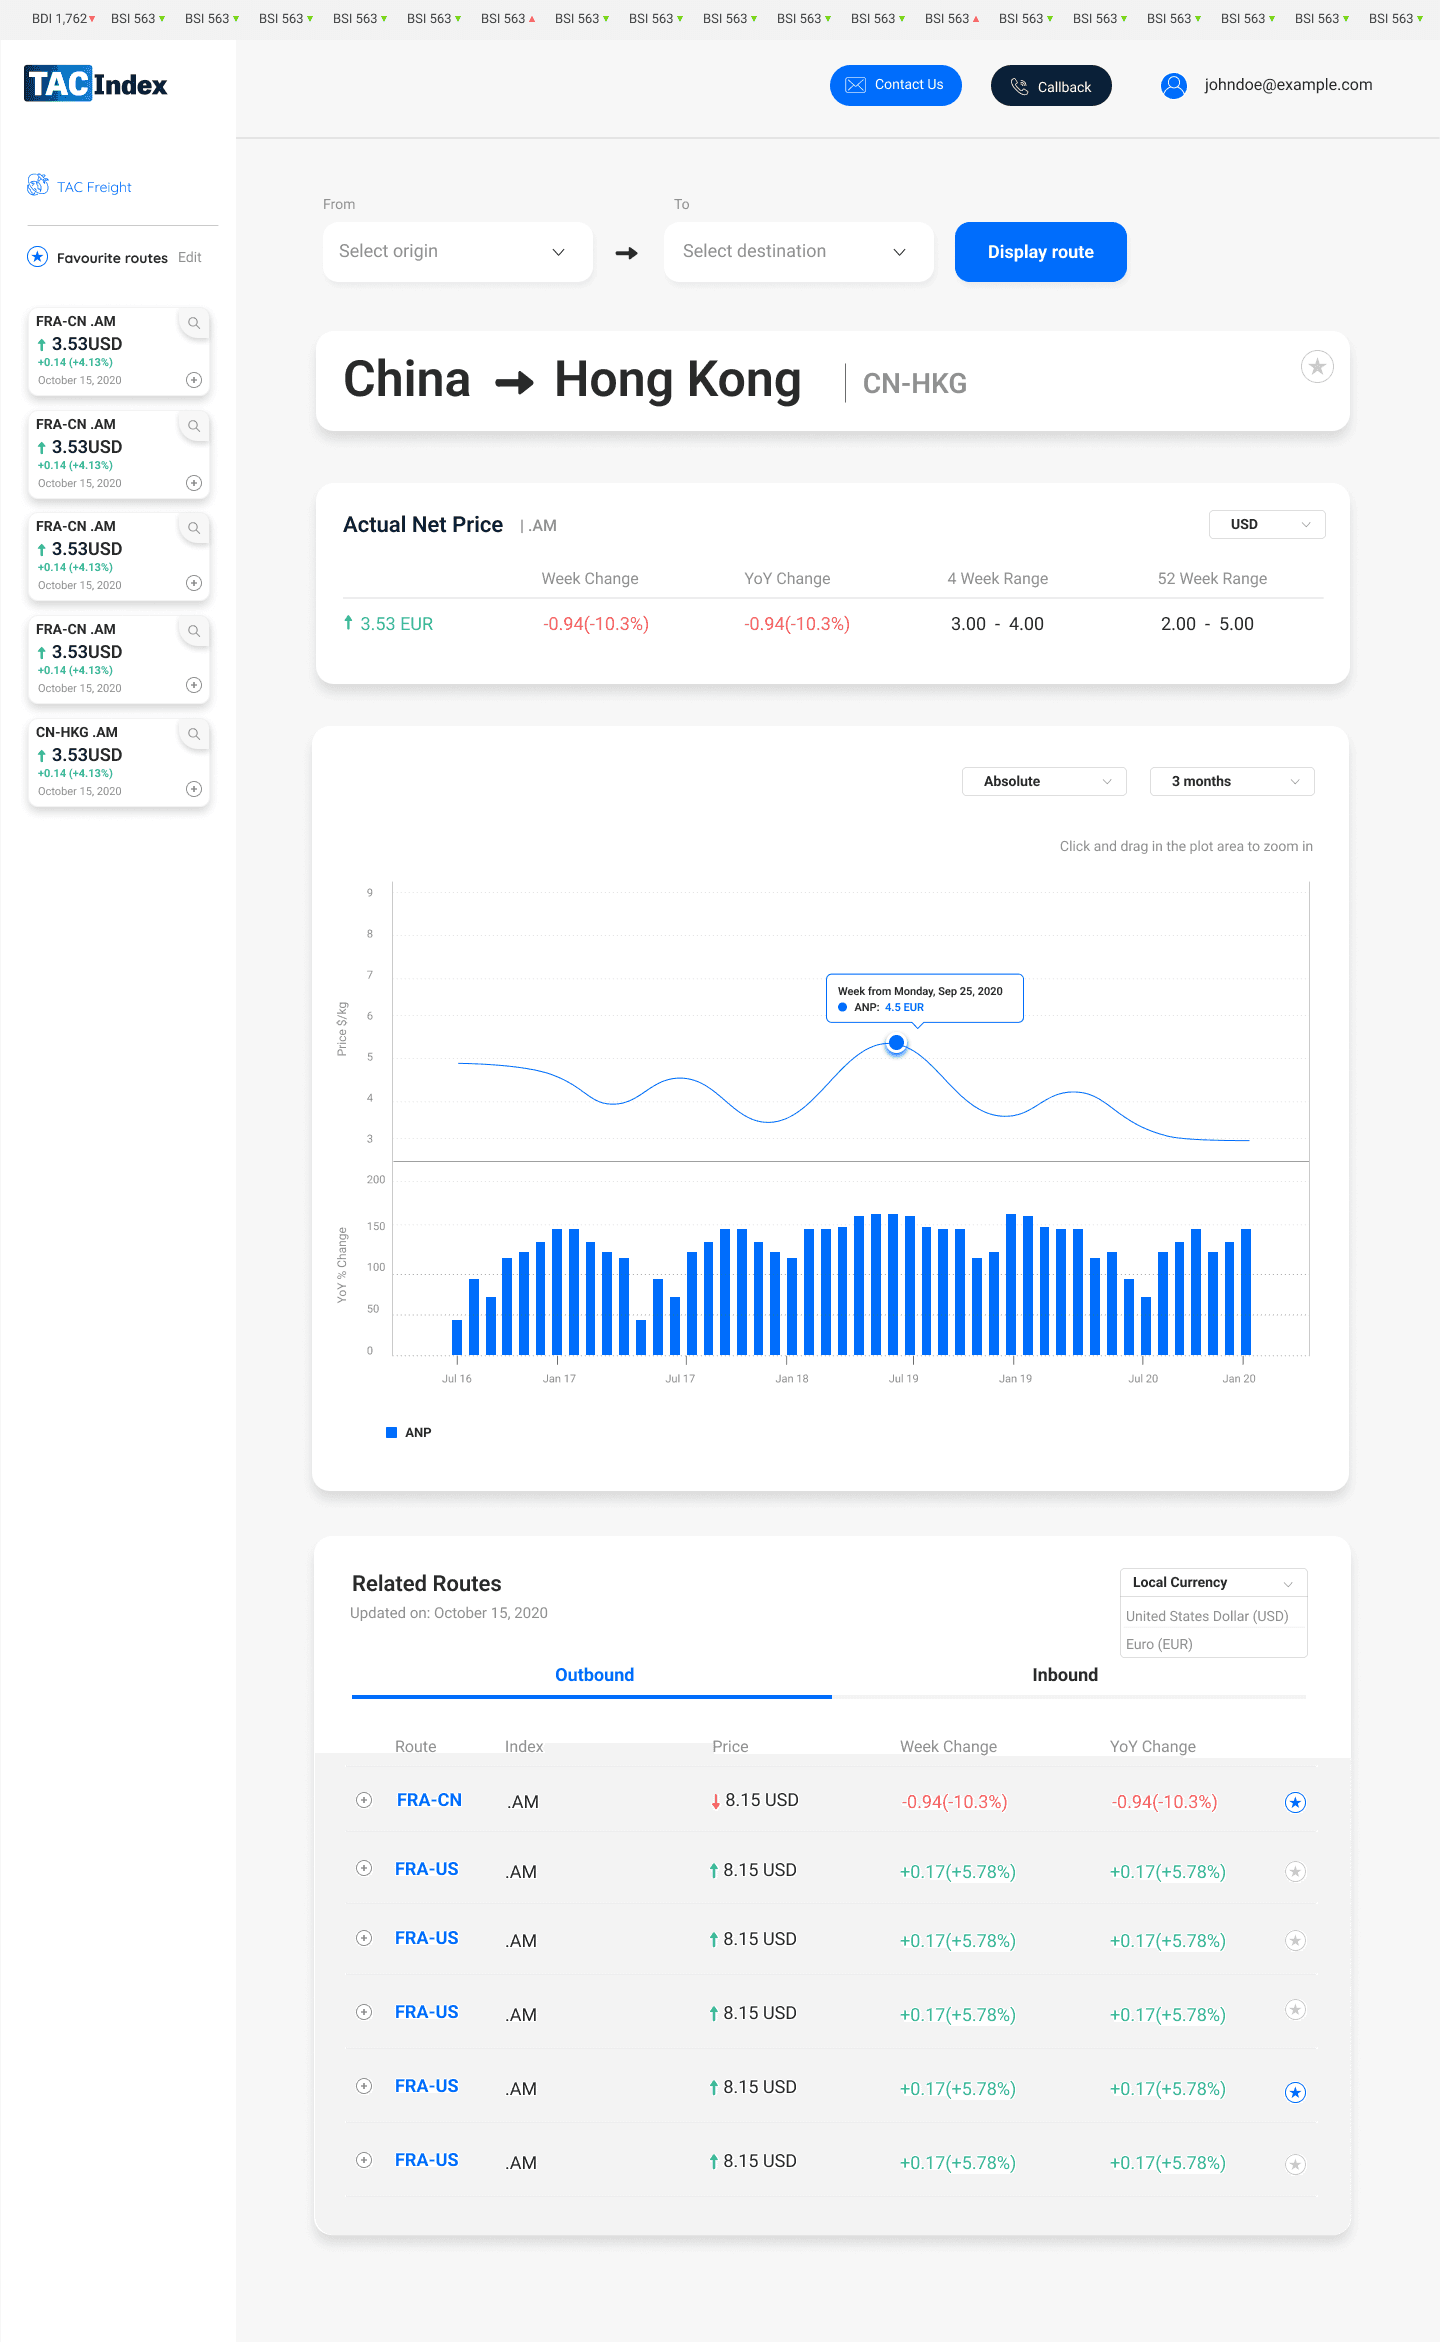
The redesigned dashboard delivered a measurable improvement in overall user satisfaction and engagement. Users reported that the new layout made it significantly easier to:
Interpret pricing trends and market movements
Compare routes and historical fluctuations
Navigate between markets without confusion
Act on insights through customizable alerts
The visual clarity, interactive graphs, and intuitive filtering system received strong positive feedback. Churn was reduced, and TAC Index successfully strengthened its positioning as a leading provider of real-time air cargo market data.
Disclosure: Designed for Tac Index under Elixus Agency.
Ally Lilith
Currently based in Malaysia · Available for global collaborations. (Timezone MYT/GMT+8)